SDG Info Design
brief
The Sustainable Development Goals [SDG's] are a collection of 17 interlinked global goals created in 2012 by the United Nations General Assembly.
Project Overview
Organize and visualize five selected data sets from the secretary general SDG report of 2021 provided by the UN. Display the data in a visual medium that would help viewers more deeply understand the information.
My Role
Research, Ideation, UI/UX, Visual design, Prototyping, Organizing
Team
Tools
Figma, Illustrator, Photoshop, Excel
Year
2021
Rationale
Interactive informative experience
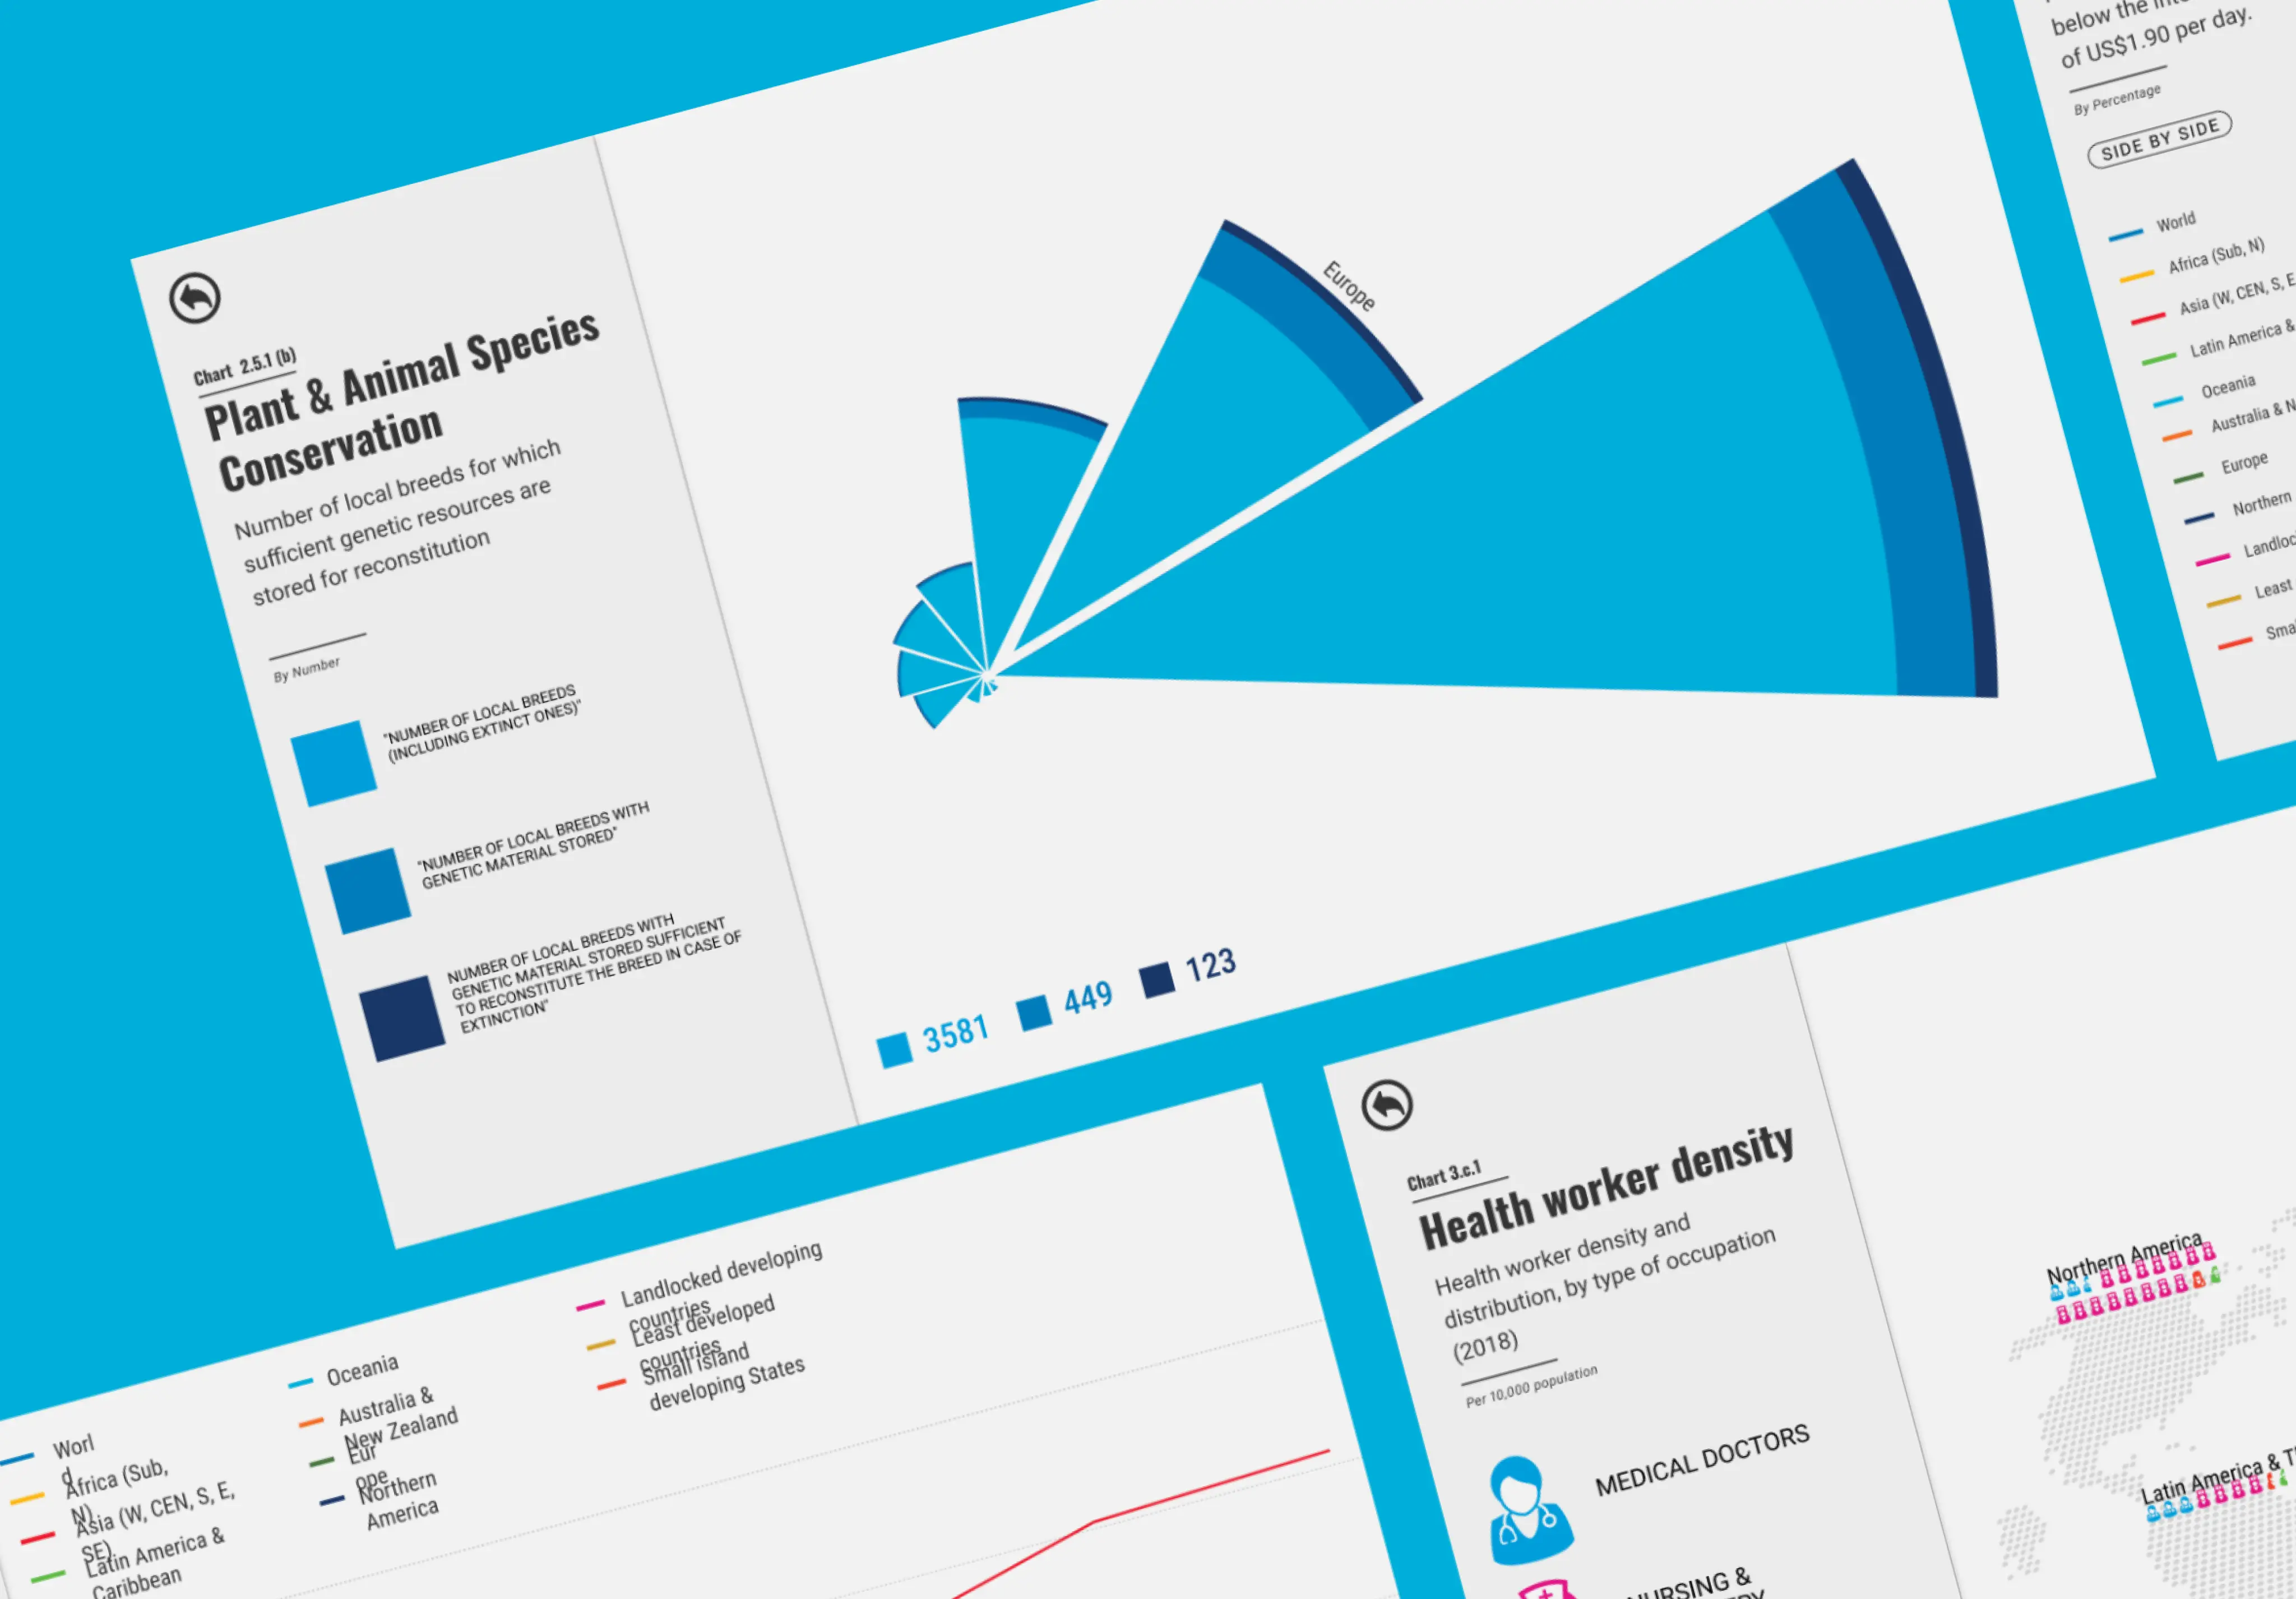
To effectively organize and visualize a large amount of data while conveying a story, I will use clear, intuitive infographics and interactive dashboards. These tools will highlight key information and trends, making complex data accessible and engaging.
Process
Rough Work
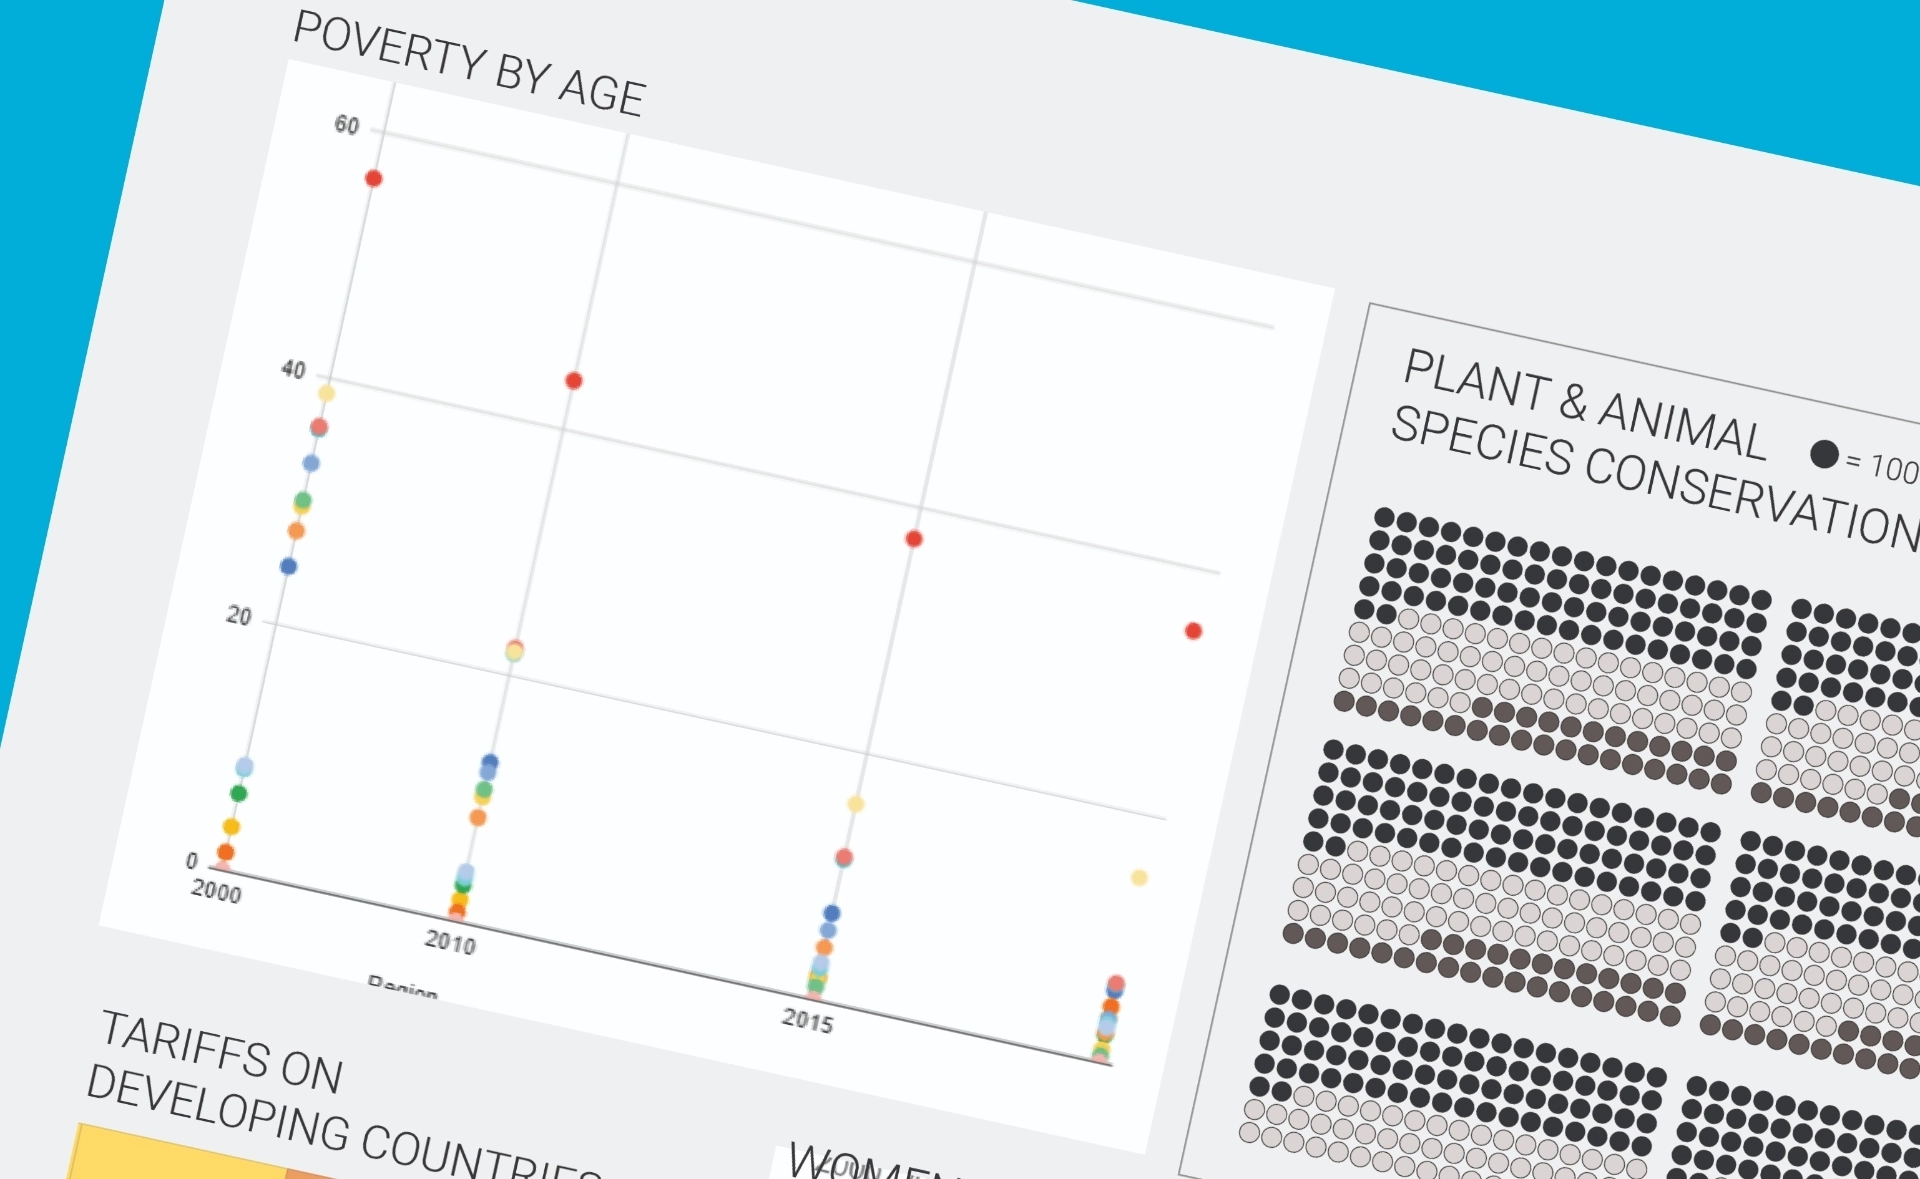
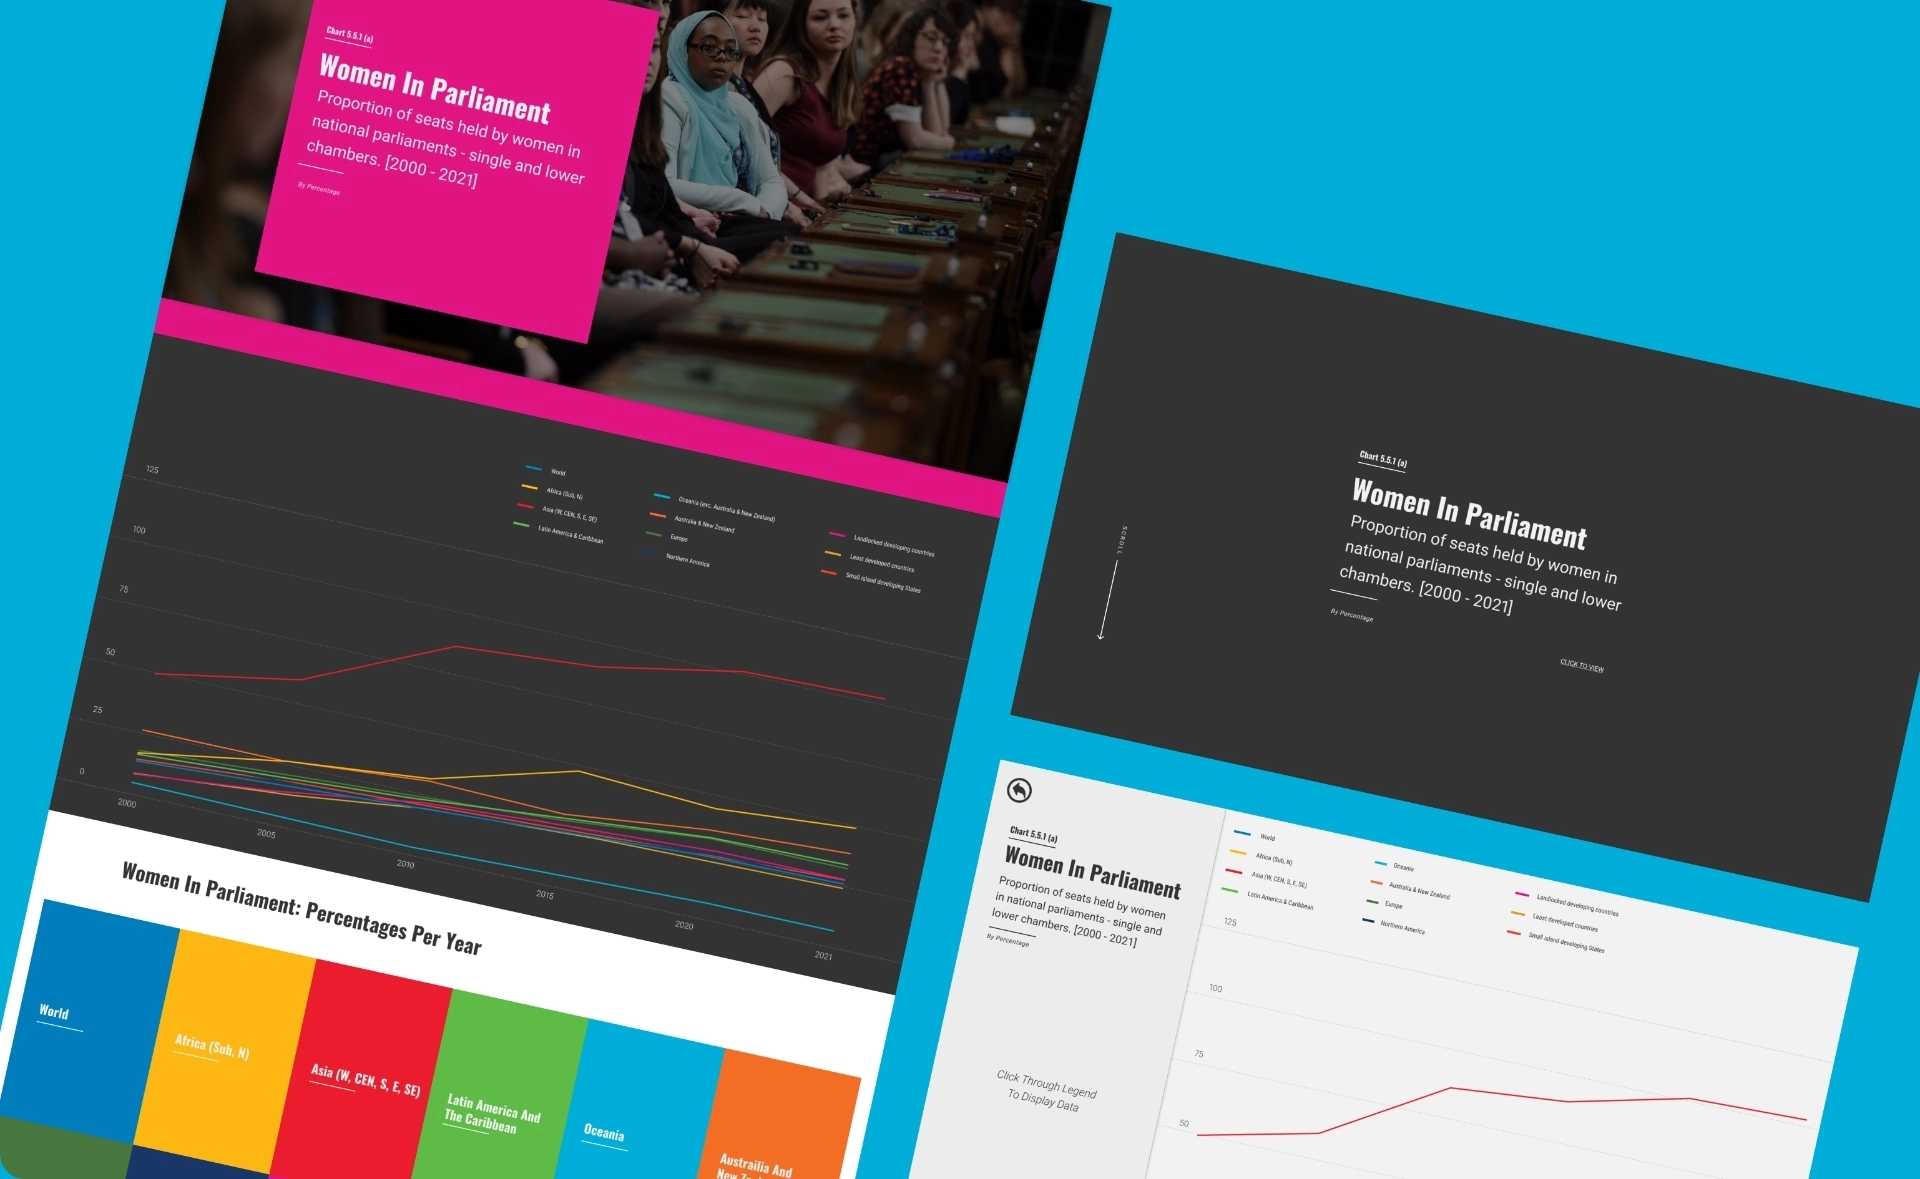
After organizing the data, I experimented with various visualization techniques to highlight key insights effectively. This process involved sketching and mood boarding to draft the initial website layout, prioritizing user flow and optimizing digital interactions to enhance engagement with the information.
Solution
Worlds eSports Capsule
By presenting data in this way, the data feels more alive and is easier to follow. Allowing viewer to easily identify patterns and insights, enabling them to make an informed inference and next steps toward achieving the Sustainable Development Goals (SDGs). This approach ensures that data is not only informative but also actionable, driving progress toward these critical global objectives.

